
What's new
initial release.
Screenshots

About
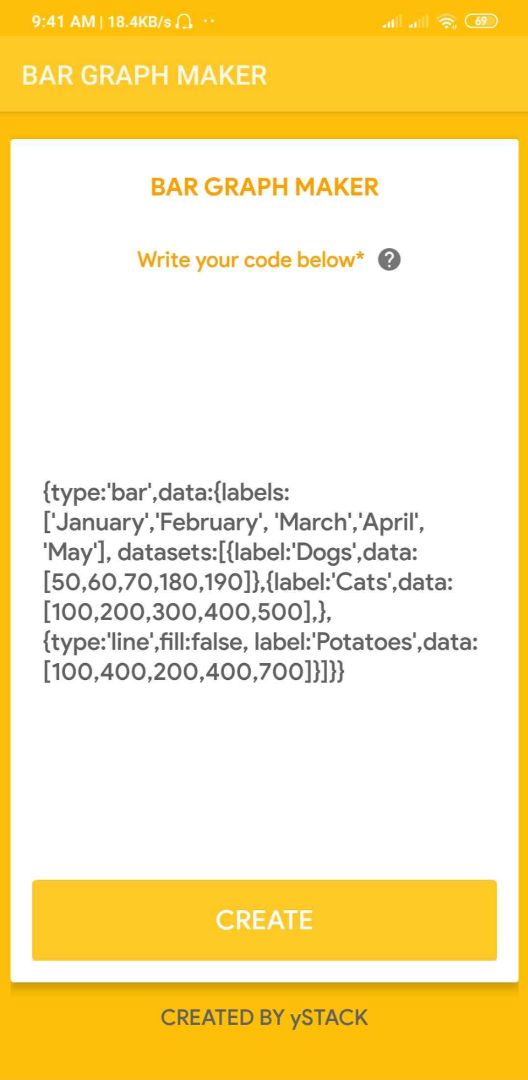
You can create all types of graphs using the graph maker... For example: bar graph, Double bar graph, etc... For creating pie chart just change the type : 'bar' to type : 'pie'.
Types of graph you can make
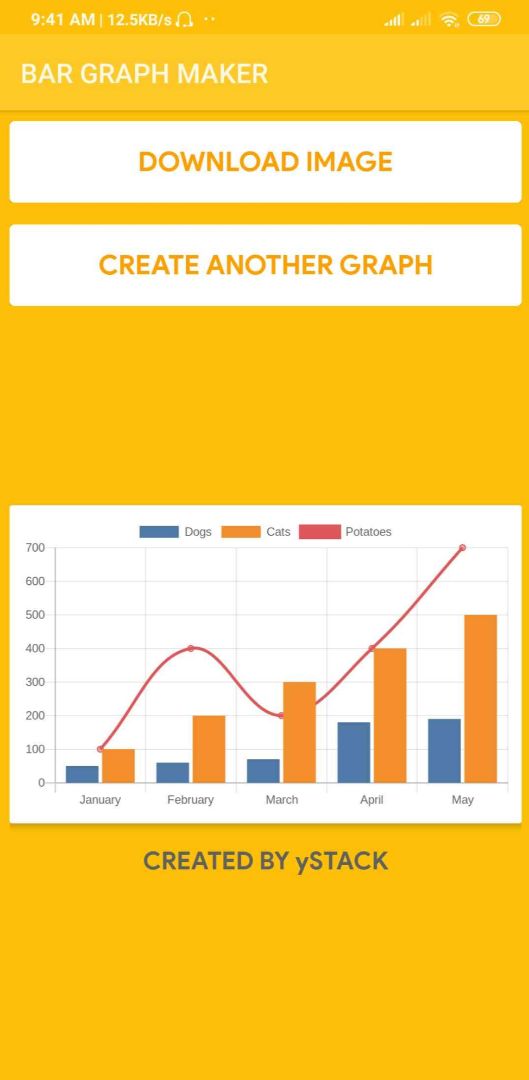
- Bar graph
{type:'bar',data:{labels:['January','February', 'March','April', 'May'], datasets:[{label:'Dogs',data:[50,60,70,180,190]},{label:'Cats',data:[100,200,300,400,500]}]}}
- Pie chart
{type:'pie',data:{labels:['January','February', 'March','April', 'May'], datasets:[{data:[50,60,70,180,190]}]}}
- Radar chart
{type:'radar',data:{labels:['January','February', 'March','April', 'May'], datasets:[{label:'Dogs',data:[50,60,70,180,190]},{label:'Cats',data:[100,200,300,400,500]}]}}
- Line graph
{type:'line',data:{labels:['January','February', 'March','April', 'May'], datasets:[{label:'Dogs', data: [50,60,70,180,190], fill:false,borderColor:'blue'},{label:'Cats', data:[100,200,300,400,500], fill:false,borderColor:'green'}]}}
- Doughnut Chart
{type:'doughnut',data:{labels:['January','February','March','April','May'],datasets:[{data:[50,60,70,180,190]}]},options:{plugins:{doughnutlabel:{labels:[{text:'550',font:{size:20}},{text:'total'}]}}}}
- Scatter Plot
{type:'scatter',data:{datasets:[{label:'Data 1',data:[{x:2,y:4},{x:3,y:3},{x:-10,y:0},{x:0,y:10},{x:10,y:5}]}]}}
More type of graphs are in the project :)
etc.... I can only write 2000 words, so that I can't write more codes it is in app
©2026 Sketchub | User Policy